
- With the same progression as in previous halving events, one can expect an improvement of more than 1689% in Bitcoin price.
- The dispute for market share control continues and limits the upward potential on the ETH price side.
The direct consequence of this event will be that Bitcoin mining revenue reduced by half.
The Bitcoin Network rewards miners with a fixed amount of Bitcoins every 10 minutes. Until now, and after the July 9, 2016 halving, the network created 12.5 Bitcoins per period, and after the imminent halving, it will create 6.25.
The reduction in Bitcoins production means a lower flow of sales in the market, and the market expects the price to adjust upwards in the face of greater scarcity.
After the 2016 halving, the price of Bitcoin went from $650 to just under $20000, a 3025% growth in a few months. After the first halving, back in 2012, the price of Bitcoin went from $12 to $650, a 5416% growth.
The declining rate of post-halving growth would project an increase of 1689 %, which at today's price means a theoretical target of $152400 per Bitcoin before the next halving in 2024.
No one knows if this scenario will crystallize or not, but the market is based on expectations, and this particular one is on the table.
The Bitcoin dominance chart shows us why the resistance to the advance that Bitcoin is experiencing just above $9000. The reasons for this are the 200-day simple moving average at the 67.16% dominance level, and especially the price congestion resistance at the 67% dominance level.

ETH/USD Daily Chart
The ETH/BTC pair is the most direct expression of the struggle to dominate the crypto market between its two top representatives.
The ETH/BTC is currently trading at the price level of 0.0231 and confirms the drilling of the 50-day exponential moving average and the 100-day simple average.
The first resistance level is at 0.0235, then the second at 0.0245 and the third one at 0.0258.
The first support level is at 0.0228, then the second at 0.022 and the third one at 0.0215.

Up provide support and help contain the downward movement.
The DMI on the daily chart shows bears losing strength once they break down the ADX line. The bulls are holding on to high levels of trending force, although they are not showing much interest in competing for the lead.
BTC/USD Daily Chart
The BTC/USD pair is currently trading at the price level of $9026 and seems to have difficulties in breaking up the price congestion resistance at $9150 again.
Above the current price, the first resistance level is at $9150, then the second at $9650 and the third one at $10400.
Below the current price, the first support level is at $8800, then the second at $8400 and the third one at $8200.

The MACD on the daily chart shows an outstanding bullish profile. The line spacing and the upward slope indicate a potential for further price increases in the coming days.
The DMI on the daily chart shows bulls trying to bounce up from the ADX line. If the buy-side fails to hold above this trend line indicator, an end of trend pattern will be triggered.
With the same progression as in previous halving events, one can expect an improvement of more than 1689% in Bitcoin price.
ETH/BTC Daily Chart
The ETH/BTC pair is the most direct expression of the struggle to dominate the crypto market between its two top representatives.
The ETH/BTC is currently trading at the price level of 0.0231 and confirms the drilling of the 50-day exponential moving average and the 100-day simple average.
The first resistance level is at 0.0235, then the second at 0.0245 and the third one at 0.0258.
The first support level is at 0.0228, then the second at 0.022 and the third one at 0.0215.
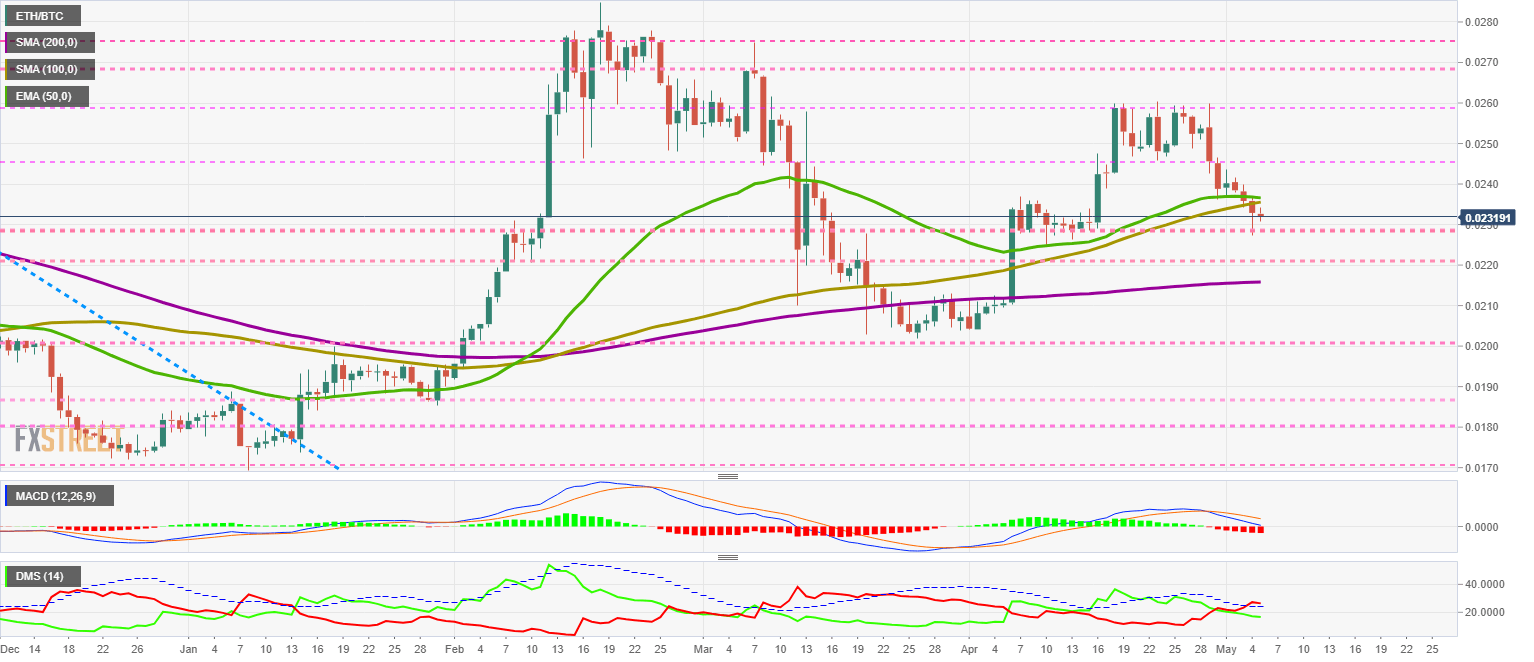
The MACD on the daily chart is already moving very close to the neutral level of the indicator, which could provide support and help contain the downward movement.
The DMI on the daily chart shows bears losing strength once they break down the ADX line. The bulls are holding on to high levels of trending force, although they are not showing much interest in competing for the lead.
Comments
Post a Comment